Gold Analysis Oct 21: Key Levels at $4,124 After Price Drop
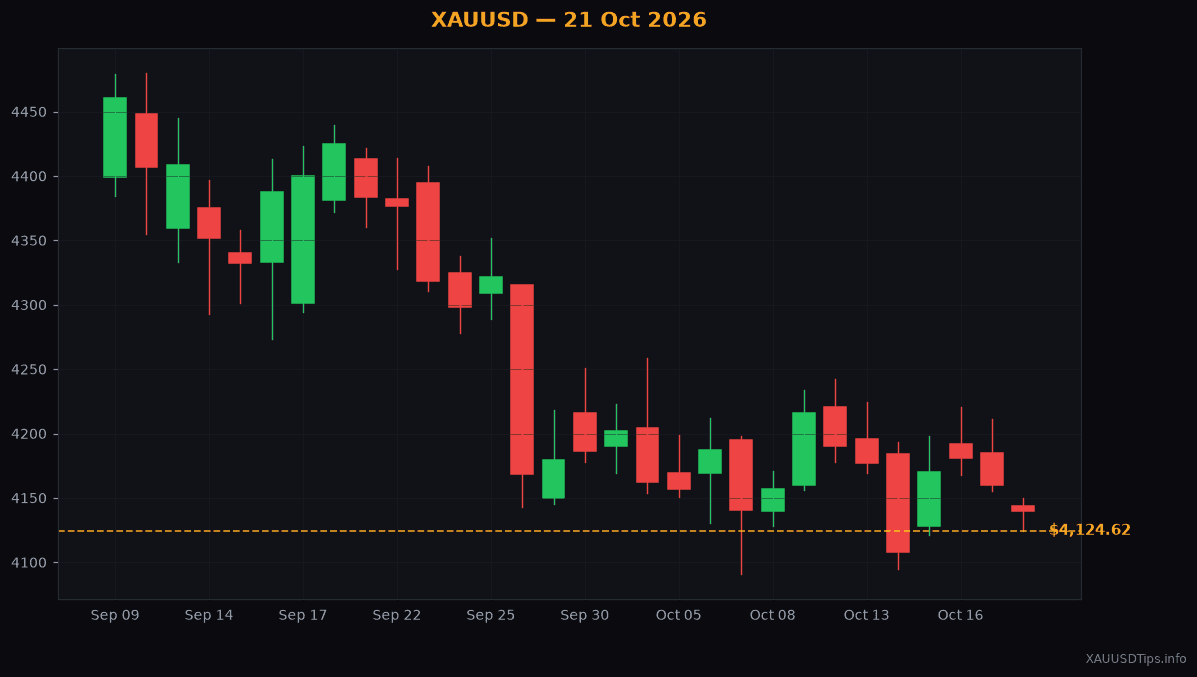
Gold dropped $20.20 to $4,124.62 today. Here are the simple technical levels and support zones every beginner should watch right now.
Gold slipped by $20.20 today, dropping to $4,124.62. If you opened your trading app this morning and saw red numbers, you might wonder what is happening. Fresh news about US trade tariffs has made investors nervous across the board. When risk appetite sours, traders move fast, pulling money out or reshuffling their positions.
Along with tariff talk, traders are also watching upcoming Fed minutes. Major news updates like interest rate discussions create temporary waves in gold trading. When economic news creates uncertainty, short-term charts often show quick price swings before settling into a clear direction.
Whether you trade digital contracts or monitor local jewellery gold rates in Pakistan, India, or Dubai, these spot price drops matter. For instance, when global spot gold drops over twenty dollars, local PKR and INR per-tola prices usually adjust shortly after. Knowing the global chart setup gives you a clear view of where prices might head next.
Let us break down the technical chart together in plain language. Yesterday, gold tried to push higher but ran into a strong wall between $4,169.00 and $4,179.00. In trading terms, we call this area resistance. Resistance is like a ceiling in a house. When the price climbs and bumps into this ceiling, buyers struggle to push it higher, and sellers take control.
Sellers did take control at that ceiling, pushing gold down toward where it sits right now. Currently, the price is testing $4,122.00. This brings us to another key concept known as support. Support is like a solid wooden floor holding the price up. It is a level where buyers usually step up to buy gold, hoping to stop it from falling deeper.
So, what should you watch for today? If gold settles firmly below this $4,122.00 support floor, the bearish path stays open. Bearish simply means the market sentiment is leaning downward, with sellers pushing prices lower. If that floor breaks, gold could continue falling toward the next target zone around $4,070.00 to $4,081.00. Some chart analysts are even watching $4,066.00 as a take-profit target.
Take profit is an automatic instruction you set with your broker to close your trade and collect your gains once the price reaches a target. It helps you secure profits without staring at your phone screen all day.
If you already opened a short trade higher up near that $4,169.00 ceiling, you might want to protect your account now. Short trading means you profit when the market price falls. A smart habit here is moving your stop-loss to breakeven. A stop-loss is your safety net—an order that exits your trade if price moves against you. Setting it to breakeven means moving it to your exact entry price. If gold suddenly turns around, you exit with zero financial loss.
Can gold turn around and rise today? It looks hard to say for sure, but markets can always surprise us. If buyers gain power and push gold back above $4,179.00, the current sell-off pauses. If that happens, gold could climb upward toward higher resistance levels around $4,220.00 to $4,235.00.
Right now, I think the best move for beginners is to remain patient. Watch how the price reacts around $4,122.00 today. Are buyers holding the floor, or are sellers breaking through? Never rush into a position out of fear of missing out. Protect your capital, start small, and let the market show its direction first.
Written by XAUUSDTips Team. Not financial advice. Trade at your own risk. Technical levels partially referenced from LiteFinance analysts.
XAUUSDTips Editorial
Published October 21, 2026