Gold Price Analysis: Key Trading Levels for 07 Sep 2026
Gold is up today at $4412.01 amid Middle East tensions, but the weekly chart shows a bearish setup. Here are the key levels to watch.
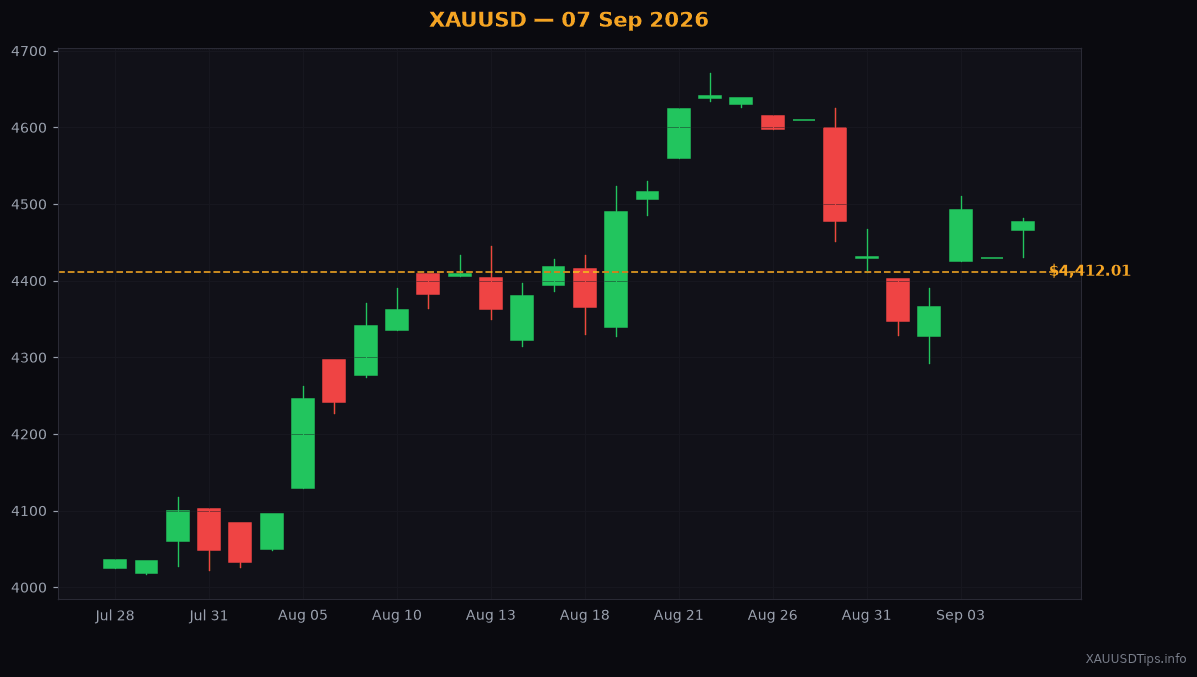
Did you see the gold charts this morning? Spot gold is sitting at $4412.01, up about $46.80 today. It is a bumpy Monday start for September 7, 2026.
If you are trading from Pakistan, India, or the UAE, you might notice your local jewellery shops are sweating. Local PKR and INR rates are swinging fast because of global events. Middle East worries are keeping everyone on edge today. When geopolitical tension rises, people naturally run to gold as a safe-haven asset. Safe-haven assets are financial shelters where investors hide their cash during scary global events.
On top of that, oil prices are climbing because of supply risks. Usually, rising oil prices lead to inflation worries. Since gold is a classic shield against inflation, this adds some extra fuel to the fire. We also saw some strong US payroll data recently, but the US Dollar failed to hold onto its gains. A weaker dollar usually makes gold cheaper for buyers using other currencies, which lifts the price.
But do not let today's green candle fool you. The bigger weekly picture looks a bit different. I think we might see some downward pressure soon. Let us look at the charts together to see where we can plan our moves.
Last week, gold fell below $4464.00. It also slipped below a key resistance zone. Resistance is like a heavy concrete ceiling. It is a price level where sellers usually gather to push the price back down. For us, this ceiling sits between $4436.00 and $4451.00.
Since gold is trading below that ceiling, the short-term trend is actually bearish. Bearish means the market looks like it wants to head lower, just like a heavy bear swiping its paws down. Even though we have a small bounce today, the bears are still technically in control of this neighborhood.
Some traders already started shorting near that ceiling when gold retested it. Shorting means selling gold now in hopes of buying it back cheaper later to pocket the difference. If you managed to open a short trade near that ceiling, you might want to hold onto it today.
Where is the floor? In our world, we call this support. Support is like a trampoline that helps the price bounce back up when it falls.
Our first major support floor is at $4367.00. If the price slides and breaks through that level, the next deep safety net is around $4282.00. These are our primary targets for the week ahead.
What if we are wrong and gold shoots straight up? You must always have a safety plan. We call this a stop loss. A stop loss is an automatic emergency brake that shuts down your trade if the price goes too far against you. It protects your account from getting wiped out. For this weekly setup, placing your stop loss at $4472.00 makes a lot of sense. That level is safely above our ceiling.
It is very easy to get emotional when big news breaks out. Tensions in the Middle East can make gold spike quickly. But successful traders do not chase green candles out of fear of missing out. We wait for the price to come to our key levels.
If you are a beginner trading from Lahore, Dhaka, or Dubai, my best advice is to stay calm. Do not risk too much of your savings on a single trade. The markets are highly volatile right now.
Let us see how the price behaves around $4412.01 as the US session opens. Will it climb back to test the ceiling at $4436.00, or will it slide toward our first floor at $4367.00? Keep your eyes on the chart, stay patient, and protect your capital.
Written by XAUUSDTips Team. Not financial advice. Trade at your own risk. Technical levels partially referenced from LiteFinance analysts.
XAUUSDTips Editorial
Published September 7, 2026