Gold Weekly Outlook 19 Oct 2026: Key Levels to Watch
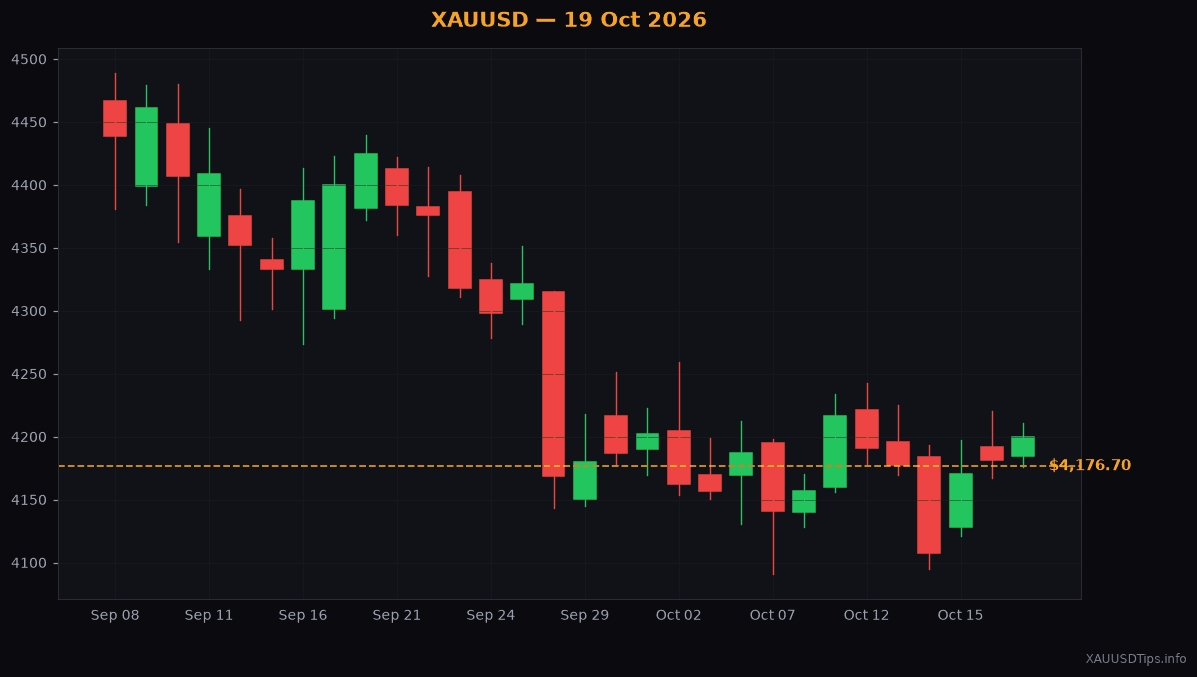
Gold spot hits $4176.70 today. Here is your simple breakdown of the key support and resistance levels for the week ahead.
Gold spot is sitting at $4176.70 right now. It gained $19.00 today. That is a nice upward push to kick off the new trading week.
Are you looking at your chart today wondering where the price goes next? I do the exact same thing every Monday morning.
There is plenty of news making noise in the background today. New tariff threats are floating around in global politics. Stock markets are trying to figure out their next move. Bitcoin took a small slide today as people got cautious.
When global news gets unpredictable, gold often gets busy. Buyers across South Asia and the UAE are watching closely too. If you keep an eye on local jewellery shops in Pakistan or India, you know PKR and INR gold rates follow these global moves very quickly.
Let us take a quiet look at the chart levels for this week without any confusing market jargon.
The Short-Term Trend
Even with gold rising $19.00 today, the overall short-term direction still points slightly downward. Think of it like walking down a mountain path. You can take a few steps uphill, but the bigger trail is still heading down.
Right now, gold is bumping against a ceiling between $4169.00 and $4179.00.
In trading, we call this ceiling resistance. Resistance is a price level where gold usually stops rising because sellers start stepping in. It acts like a roof holding the price down.
If sellers hold their ground at this $4179.00 area, the price could easily bounce off and start dropping again.
Lower Targets to Keep on Your Radar
If the ceiling holds and price turns lower, where does it head?
The first main target on the downside is $4122.00. We call a price floor like this support. Support is a price level where gold usually stops falling because buyers step in to catch it, just like a solid floor.
If $4122.00 fails to hold, the next price floor sits lower down near $4066.00.
When traders expect price to drop from a ceiling toward a floor, they look for a short trade. A short trade simply means placing an order that benefits if the price falls. But you should never rush into one without seeing clear confirmation.
What If Gold Keeps Climbing?
What happens if buyers push the price straight through $4179.00 today?
That upward move is called a correction. A correction is a temporary move against the main background direction.
If gold breaks above $4179.00, the path opens up toward a higher ceiling between $4220.00 and $4235.00.
This upper zone is very important. It marks the upper boundary line of the current short-term trend. Many big institutional sellers wait around $4235.00 to place new orders. I think watching how gold handles $4179.00 today will tell us a lot about the rest of the week.
How to Plan Your Week
You do not need to hurry into any position today.
Sitting on your hands is often the safest trade you can make. It is always better to wait for clear signals than to guess where the chart goes next.
Keep an eye on $4179.00 today. Watch whether the price turns back down or breaks out higher with strong energy.
Whether you trade XAUUSD online from Lahore or buy physical gold bars in Dubai, knowing these levels keeps you calm and focused.
Take your time, watch your risk, and protect your account.
Written by XAUUSDTips Team. Not financial advice. Trade at your own risk. Technical levels partially referenced from LiteFinance analysts.
XAUUSDTips Editorial
Published October 19, 2026